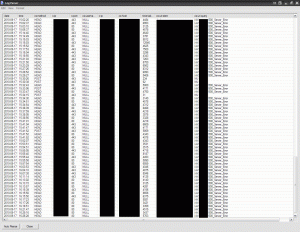
I love Logparser but sometimes I don’t want large amounts of data in a command prompt. And you may not want to drop it into a csv file either, you just want a nice readable output in front of your face immediately. So I like to use the DATAGRID output option which gives me a nice neat GUI output for these situations. Here is an example I used this morning to pull all the IIS error 500 messages in an IIS W3C formated log file:
logparser "SELECT date, time, cs-method, s-ip, s-port, cs-username, c-ip, cs-host, time-taken, cs-uri-stem, cs-uri-query FROM C:\Logs\ex100917.log WHERE sc-status = 500" -rtp:-1 -i:iisw3c -o:datagrid
and here’s one to see the average time taken on every page on your site. This is great to pinpoint those pages with high load times that you can possible optimize. In this example, I want to include every page in my stats except those that threw an error 500:
logparser -i:IISW3C "SELECT cs-uri-stem, AVG(time-taken) As AvgTimeTaken FROM C:\Logs\ex100917.log WHERE sc-status <> 500 GROUP BY cs-uri-stem ORDER BY AvgTimeTaken DESC" -q:ON -o:datagrid
Now we know how pages normally perform. Now let’s compare that to the pages that did have error 500s. I also want to add a column for the total number of error 500s on each page. So a slight modification in the query:
logparser -i:IISW3C "SELECT cs-uri-stem, Count(*) AS Error500Hits, AVG(time-taken) As AvgTimeTaken FROM C:\Logs\ex100917.log WHERE sc-status = 500 GROUP BY cs-uri-stem ORDER BY AvgTimeTaken DESC" -q:ON -o:datagrid
All the data that is output using datagrid exports to an Excel spreadsheet nicely. Just right click, Select All and then copy and paste into your .xlsx spreadsheet.
Jason Samuel is a visionary product leader and trusted advisor with a proven track record of shaping strategy and driving technology innovation. With extensive expertise in enterprise end-user computing, security, cloud, automation, and virtualization technologies, Jason has become a globally recognized authority in the IT industry. His career spans consulting for hundreds of Fortune 500 enterprises across diverse business sectors worldwide, delivering cutting-edge digital solutions from Citrix, Microsoft, VMware, Amazon, Google, and NVIDIA that seamlessly balance security with exceptional user experiences.
Jason’s leadership is amplified by his dedication to knowledge-sharing as an author, speaker, podcaster, and mentor within the global IT and technology community. Recognized with numerous prestigious awards, Jason’s contributions underscore his commitment to advancing technology and empowering organizations to achieve transformative results. Follow him on LinkedIn.
Disclaimer: Views expressed here are his own and do not reflect the views of his employer, past or present, or any organizations he is affiliated with. Content is for informational or personal purposes only.


Thanks a lot for this article!
Hi Jason, I read your blogs and its quite good and eye opening for me. I need an input from…
I'm with Richard Powell and Andreas Mariotti. Things work if I do it the USB redirection way, but not with…
We see this behaviour with 2203 CU2 VDAs and while being happy, that there is at leasy an workaround without…
Saved my butt without playing around over dozens attempts to get that certificate installed! Thank you! <3 Chris